
Back to Courses


Data Science Courses - Page 118
Showing results 1171-1180 of 1407
Visualizing Data in the Tidyverse
Data visualization is a critical part of any data science project. Once data have been imported and wrangled into place, visualizing your data can help you get a handle on what’s going on in the data set. Similarly, once you’ve completed your analysis and are ready to present your findings, data visualizations are a highly effective way to communicate your results to others. In this course we will cover what data visualization is and define some of the basic types of data visualizations.
In this course you will learn about the ggplot2 R package, a powerful set of tools for making stunning data graphics that has become the industry standard. You will learn about different types of plots, how to construct effect plots, and what makes for a successful or unsuccessful visualization.
In this specialization we assume familiarity with the R programming language. If you are not yet familiar with R, we suggest you first complete R Programming before returning to complete this course.
Migrate for Anthos: Qwik Start
This is a self-paced lab that takes place in the Google Cloud console. In this lab you'll use Migrate for Anthos to migrate a Compute Engine VM instance to a corresonding container image hosted in a Kubernetes pod.
Building Machine Learning Pipelines in PySpark MLlib
By the end of this project, you will learn how to create machine learning pipelines using Python and Spark, free, open-source programs that you can download. You will learn how to load your dataset in Spark and learn how to perform basic cleaning techniques such as removing columns with high missing values and removing rows with missing values. You will then create a machine learning pipeline with a random forest regression model. You will use cross validation and parameter tuning to select the best model from the pipeline. Lastly, you will evaluate your model’s performance using various metrics.
A pipeline in Spark combines multiple execution steps in the order of their execution. So rather than executing the steps individually, one can put them in a pipeline to streamline the machine learning process. You can save this pipeline, share it with your colleagues, and load it back again effortlessly.
Note: You should have a Gmail account which you will use to sign into Google Colab.
Note: This course works best for learners who are based in the North America region. We’re currently working on providing the same experience in other regions.
Calculus through Data & Modelling: Series and Integration
This course continues your study of calculus by introducing the notions of series, sequences, and integration. These foundational tools allow us to develop the theory and applications of the second major tool of calculus: the integral. Rather than measure rates of change, the integral provides a means for measuring the accumulation of a quantity over some interval of input values. This notion of accumulation can be applied to different quantities, including money, populations, weight, area, volume, and air pollutants. The concepts in this course apply to many other disciplines outside of traditional mathematics. Through projects, we will apply the tools of this course to analyze and model real world data, and from that analysis give critiques of policy.
Following the pattern as with derivatives, several important methods for calculating accumulation are developed. Our course begins with the study of the deep and significant result of the Fundamental Theorem of Calculus, which develops the relationship between the operations of differentiation and integration. If you are interested in learning more advanced mathematics, this course is the right course for you.
Introduction to Deep Learning
Deep Learning is the go-to technique for many applications, from natural language processing to biomedical. Deep learning can handle many different types of data such as images, texts, voice/sound, graphs and so on. This course will cover the basics of DL including how to build and train multilayer perceptron, convolutional neural networks (CNNs), recurrent neural networks (RNNs), autoencoders (AE) and generative adversarial networks (GANs). The course includes several hands-on projects, including cancer detection with CNNs, RNNs on disaster tweets, and generating dog images with GANs.
Prior coding or scripting knowledge is required. We will be utilizing Python extensively throughout the course. We recommend taking the two previous courses in the specialization, Introduction to Machine Learning: Supervised Learning and Unsupervised Algorithms in Machine Learning, but they are not required. College-level math skills, including Calculus and Linear Algebra, are needed. Some parts of the class will be relatively math intensive.
This course can be taken for academic credit as part of CU Boulder’s Master of Science in Data Science (MS-DS) degree offered on the Coursera platform. The MS-DS is an interdisciplinary degree that brings together faculty from CU Boulder’s departments of Applied Mathematics, Computer Science, Information Science, and others. With performance-based admissions and no application process, the MS-DS is ideal for individuals with a broad range of undergraduate education and/or professional experience in computer science, information science, mathematics, and statistics. Learn more about the MS-DS program at https://www.coursera.org/degrees/master-of-science-data-science-boulder.
Course logo image by Ryan Wallace on Unsplash.
Machine Learning: Predict Numbers from Handwritten Digits using a Neural Network, Keras, and R
In this 1-hour long project-based course, you will learn how to build a Neural Network Model using Keras and the MNIST Data Set. By the end of the course you will have built a model that will recognize the digits of hand written numbers. You will also be exposed to One Hot Encoding, Neural Network Architecture, Loss Optimizers and Testing of the Model's performance.
Note: This course works best for learners who are based in the North America region. We’re currently working on providing the same experience in other regions.
Database Management Essentials
Database Management Essentials provides the foundation you need for a career in database development, data warehousing, or business intelligence, as well as for the entire Data Warehousing for Business Intelligence specialization. In this course, you will create relational databases, write SQL statements to extract information to satisfy business reporting requests, create entity relationship diagrams (ERDs) to design databases, and analyze table designs for excessive redundancy. As you develop these skills, you will use either Oracle, MySQL, or PostgreSQL to execute SQL statements and a database diagramming tool such as the ER Assistant or Visual Paradigm to create ERDs. We’ve designed this course to ensure a common foundation for specialization learners. Everyone taking the course can jump right in with writing SQL statements in Oracle, MySQL, or PostgreSQL.
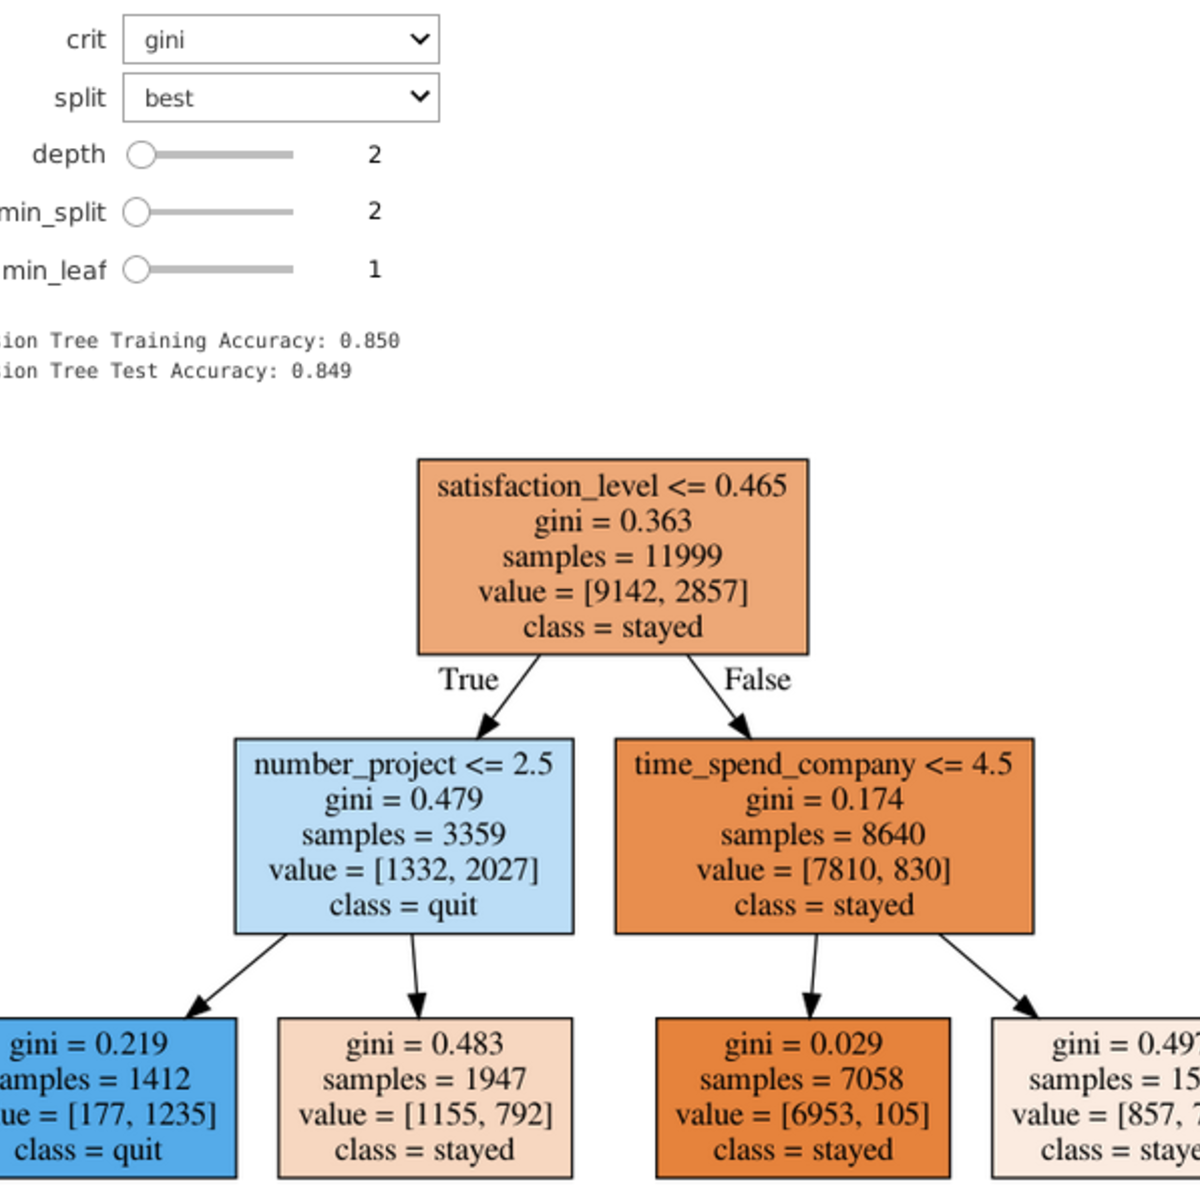
Predict Employee Turnover with scikit-learn
Welcome to this project-based course on Predicting Employee Turnover with Decision Trees and Random Forests using scikit-learn. In this project, you will use Python and scikit-learn to grow decision trees and random forests, and apply them to an important business problem. Additionally, you will learn to interpret decision trees and random forest models using feature importance plots. Leverage Jupyter widgets to build interactive controls, you can change the parameters of the models on the fly with graphical controls, and see the results in real time!
This course runs on Coursera's hands-on project platform called Rhyme. On Rhyme, you do projects in a hands-on manner in your browser. You will get instant access to pre-configured cloud desktops containing all of the software and data you need for the project. Everything is already set up directly in your internet browser so you can just focus on learning. For this project, you’ll get instant access to a cloud desktop with Python, Jupyter, and scikit-learn pre-installed.
Data Management for Clinical Research
This course presents critical concepts and practical methods to support planning, collection, storage, and dissemination of data in clinical research.
Understanding and implementing solid data management principles is critical for any scientific domain. Regardless of your current (or anticipated) role in the research enterprise, a strong working knowledge and skill set in data management principles and practice will increase your productivity and improve your science. Our goal is to use these modules to help you learn and practice this skill set.
This course assumes very little current knowledge of technology other than how to operate a web browser. We will focus on practical lessons, short quizzes, and hands-on exercises as we explore together best practices for data management.
Financial Regulation in Emerging Markets and the Rise of Fintech Companies
This course gives an overview of the changing regulatory environment since the 1997 Asian and 2008 global financial crisis. Following these two major crises, governments around the globe enacted a set of far-reaching new financial regulations that are aimed towards safeguarding financial stability. However, banks find it increasingly difficult to be profitable in this new regulatory environment. Technology, at the same time, has taken important leaps forward with the emergence of sophisticated models of artificial intelligence and the invention of the blockchain. These two developments fuel the emergence of fintech companies around the world.
This course discusses fintech regulation in emerging markets using case studies from China and South Africa. The course pays special attention to the socioeconomic environment in emerging markets, as well as to political risk as a major source of uncertainty for fintech entrepreneurs. Peer-to-peer lending and remittances are used as leading examples for fintech innovation in emerging markets.
Popular Internships and Jobs by Categories
Browse
© 2024 BoostGrad | All rights reserved