Back to Courses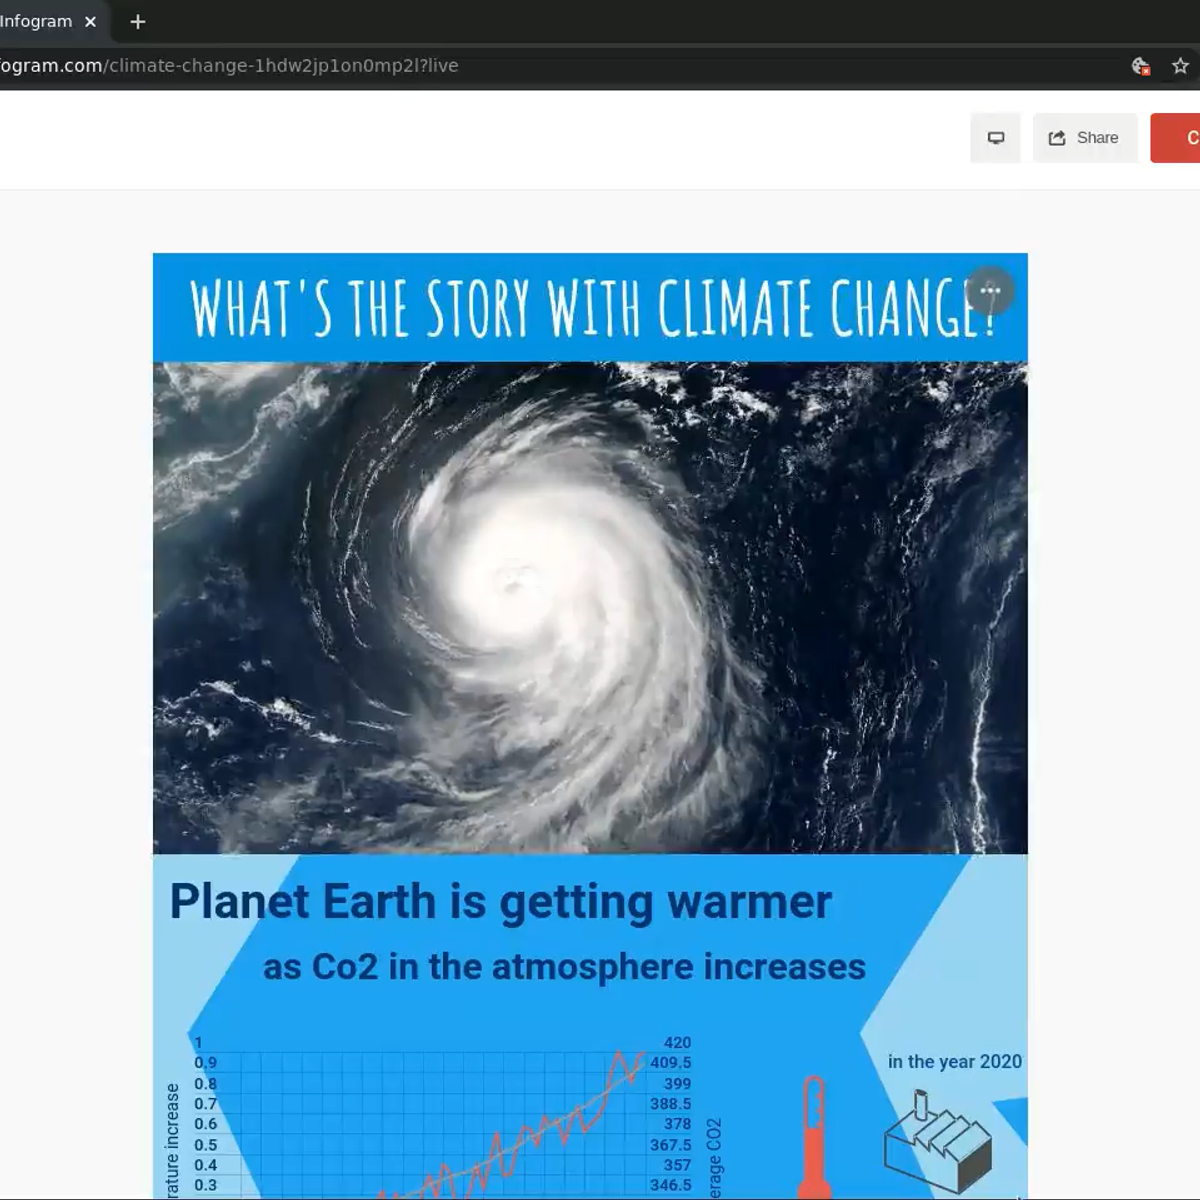


Data Science Courses - Page 10
Showing results 91-100 of 1407
Create an infographic with Infogram
In this 2-hour long project-based course, you will learn how to design effectively an infographic with infogram.com, adding line, bar and map charts, and connecting the data story with text and visuals.
Note: This course works best for learners who are based in the North America region. We’re currently working on providing the same experience in other regions.
Mastering Data Analysis with Pandas
In this structured series of hands-on guided projects, we will master the fundamentals of data analysis and manipulation with Pandas and Python. Pandas is a super powerful, fast, flexible and easy to use open-source data analysis and manipulation tool. This guided project is the first of a series of multiple guided projects (learning path) that is designed for anyone who wants to master data analysis with pandas.
Note: This course works best for learners who are based in the North America region. We’re currently working on providing the same experience in other regions.
SQL Functions
By the end of this project, you will create a number of examples that will develop your learning around functions in SQL. This course will enable you to take your beginner knowledge of SQL to the next level by incorporating functions into your programming. Thus, you will be able to develop more complex code and be able to solve more difficult problems. Thus, you will be able to develop more complex code and be able to solve more difficult problems. This course will provide students with the knowledge behind different functions in SQL such as string functions, numeric functions, date functions, null SQL functions, stored functions and stored procedures. This project will take students through a number of examples demonstrating SQL functions based on a database. You will gain an understanding of these concepts from the in-depth examples provided.
Note: This course works best for learners who are based in the North America region. We’re currently working on providing the same experience in other regions.
Introduction to Machine Learning: Supervised Learning
In this course, you’ll be learning various supervised ML algorithms and prediction tasks applied to different data. You’ll learn when to use which model and why, and how to improve the model performances. We will cover models such as linear and logistic regression, KNN, Decision trees and ensembling methods such as Random Forest and Boosting, kernel methods such as SVM.
Prior coding or scripting knowledge is required. We will be utilizing Python extensively throughout the course. In this course, you will need to have a solid foundation in Python or sufficient previous experience coding with other programming languages to pick up Python quickly.
We will be learning how to use data science libraries like NumPy, pandas, matplotlib, statsmodels, and sklearn. The course is designed for programmers beginning to work with those libraries. Prior experience with those libraries would be helpful but not necessary.
College-level math skills, including Calculus and Linear Algebra, are required. Our hope for this course is that the math will be understandable but not intimidating.
This course can be taken for academic credit as part of CU Boulder’s Master of Science in Data Science (MS-DS) degree offered on the Coursera platform. The MS-DS is an interdisciplinary degree that brings together faculty from CU Boulder’s departments of Applied Mathematics, Computer Science, Information Science, and others. With performance-based admissions and no application process, the MS-DS is ideal for individuals with a broad range of undergraduate education and/or professional experience in computer science, information science, mathematics, and statistics. Learn more about the MS-DS program at https://www.coursera.org/degrees/master-of-science-data-science-boulder.
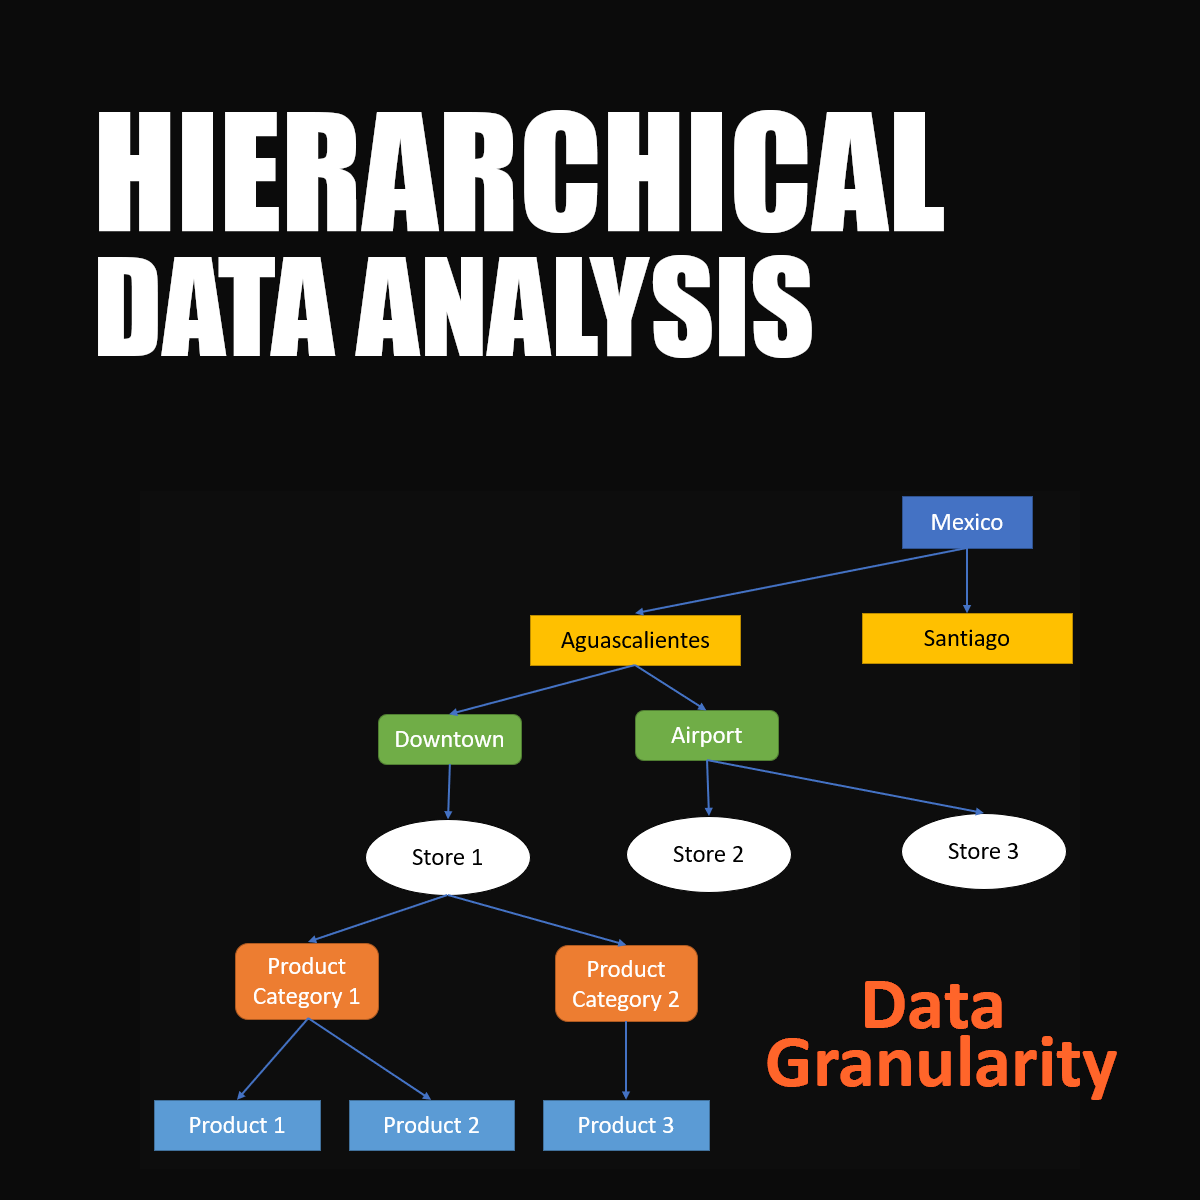
Hierarchical relational data analysis using python
By the end of this project you will learn how to analyze Hierarchical Data. we are going to work with a dataset related to Mexico toy sales. The dataset contains some hierarchical data about different products sold in different stores in different cities in Mexico. we are going to load this data and after some preprocessing steps, we are going to learn how to analyze this data using different visualization techniques. During this project we are going to learn about a very important concept called Data Granularity. And we will also learn how to use different levels of granularity to answer some analytical question. and at the end we are going to talk about Treemaps and Sunburst Diagram, two handy visualization techniques used for hierarchical data.
Robot Localization with Python and Particle Filters
In this one hour long project-based course, you will tackle a real-world problem in robotics. We will be simulating a robot that can move around in an unknown environment, and have it discover its own location using only a terrain map and an elevation sensor. We will encounter some of the classic challenges that make robotics difficult: noisy sensor data, and imprecise movement.
We will tackle these challenges with an artificial intelligence technique called a particle filter.
By the end of this project, you will have coded a particle filter from scratch using Python and numpy.
Note: This course works best for learners who are based in the North America region. We’re currently working on providing the same experience in other regions.
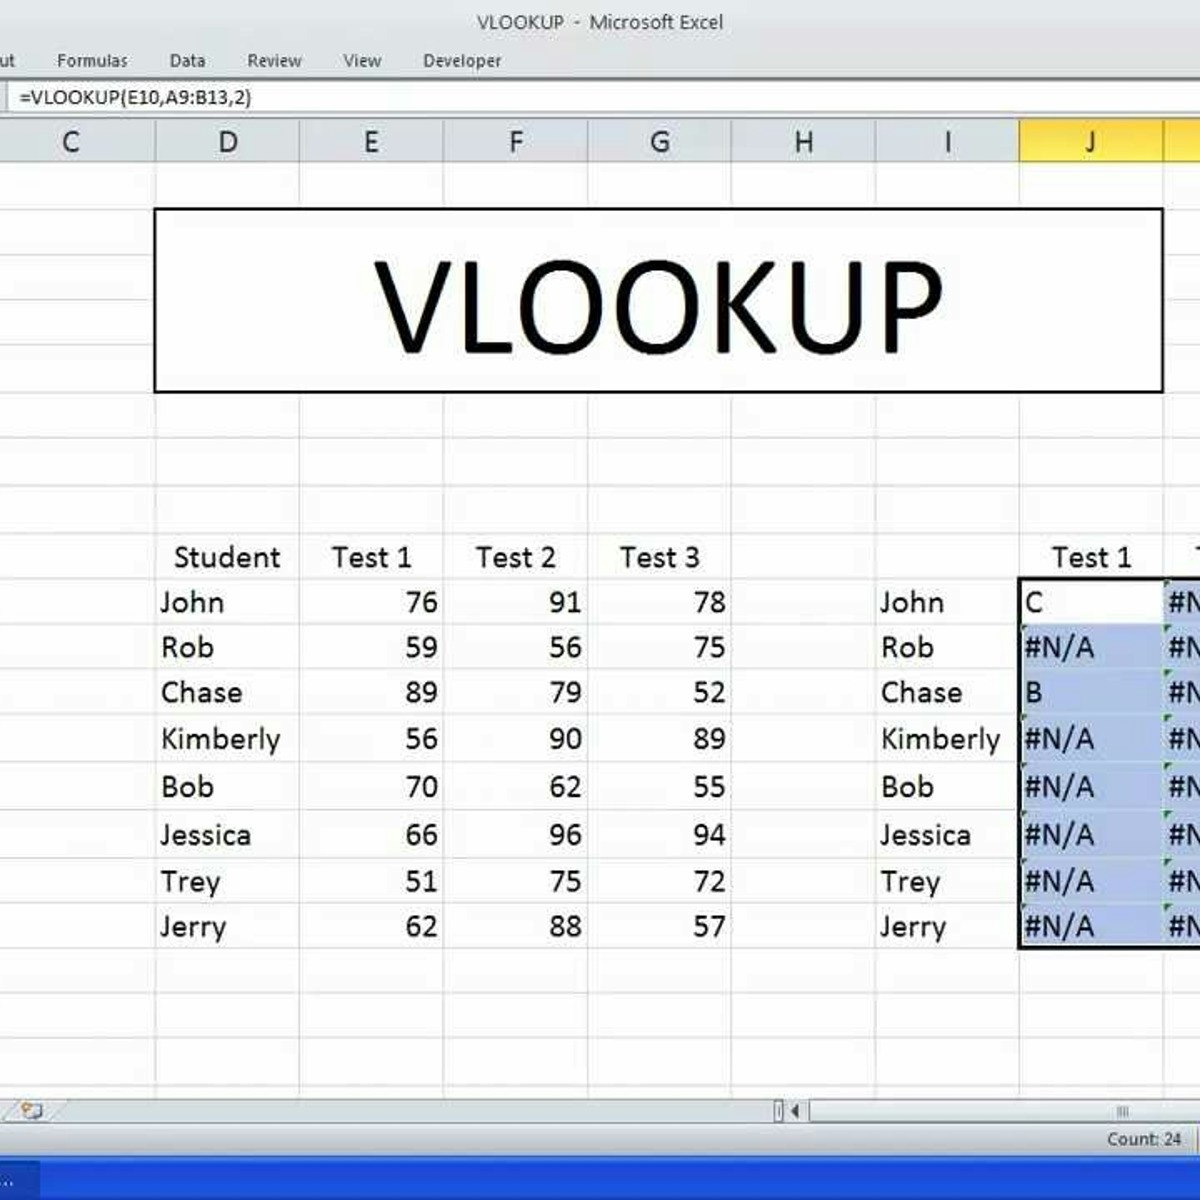
How to Use Lookup Reference Math and Text Functions in Excel
By the end of this project, you will learn how to use lookup reference, math and text functions in an Excel Spreadsheet by using a free version of Microsoft Office Excel.
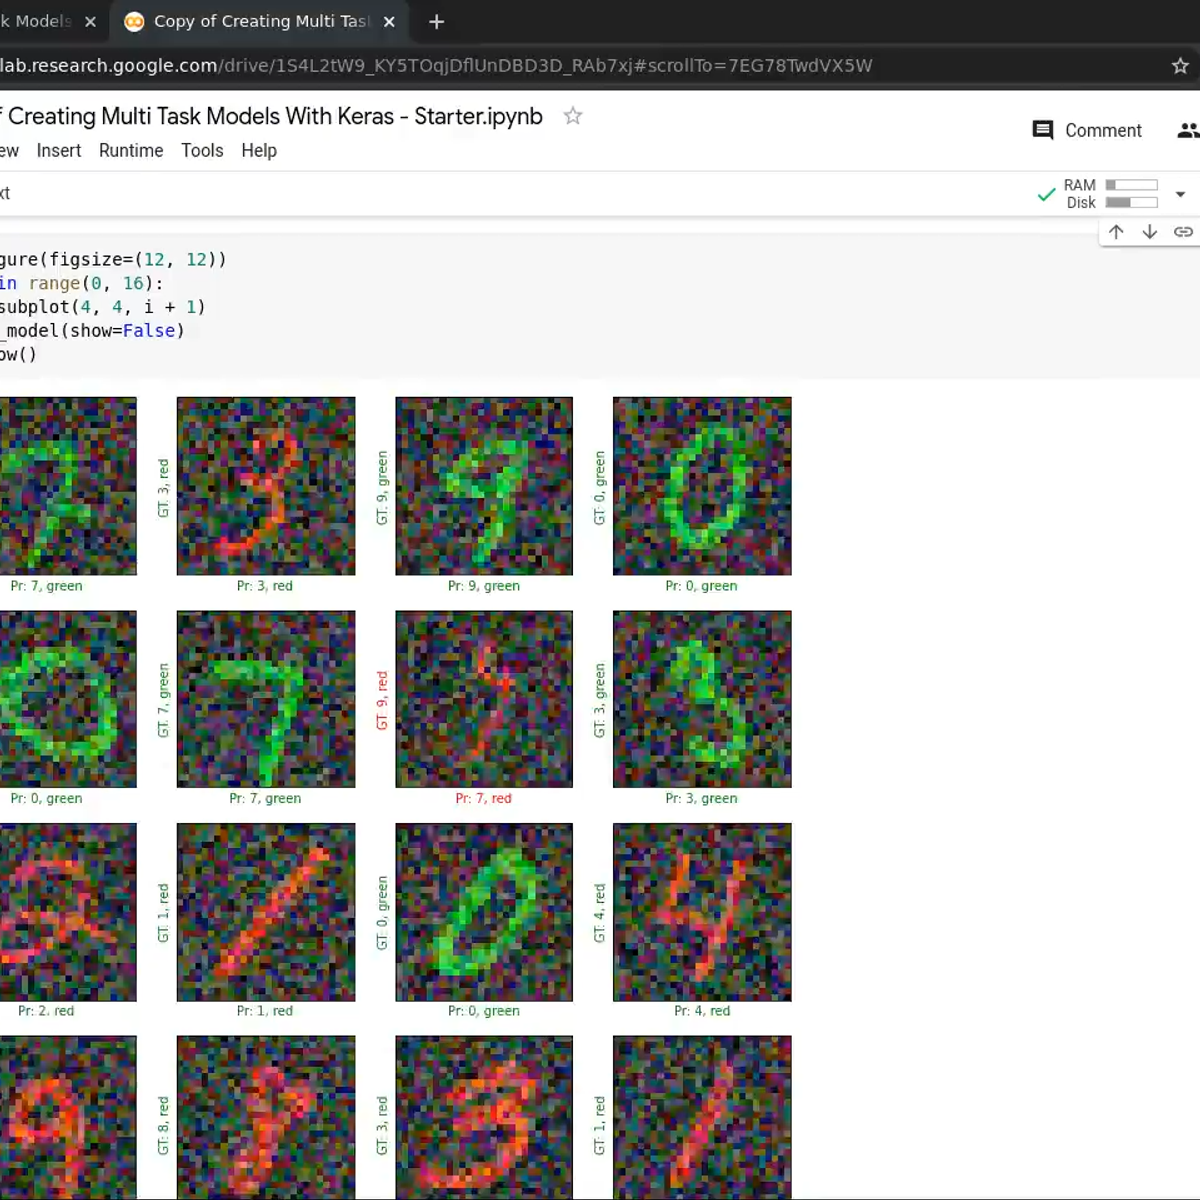
Creating Multi Task Models With Keras
In this 1 hour long guided project, you will learn to create and train multi-task, multi-output models with Keras. You will learn to use Keras' functional API to create a multi output model which will be trained to learn two different labels given the same input example. The model will have one input but two outputs. A few of the shallow layers will be shared between the two outputs, you will also use a ResNet style skip connection in the model. If you are familiar with Keras, you have probably come across examples of models that are trained to perform multiple tasks. For example, an object detection model where a CNN is trained to find all class instances in the input images as well as give a regression output to localize the detected class instances in the input. Being able to use Keras' functional API is a first step towards building complex, multi-output models like object detection models.
We will be using TensorFlow as our machine learning framework. The project uses the Google Colab environment. You will need prior programming experience in Python. You will also need prior experience with Keras. Consider this to be an intermediate level Keras project. This is a practical, hands on guided project for learners who already have theoretical understanding of Neural Networks, Convolutional Neural Networks, and optimization algorithms like gradient descent but want to understand how to use use Keras to write custom, more complex models than just plain sequential neural networks.
Note: This course works best for learners who are based in the North America region. We’re currently working on providing the same experience in other regions.
NLP: Twitter Sentiment Analysis
In this hands-on project, we will train a Naive Bayes classifier to predict sentiment from thousands of Twitter tweets. This project could be practically used by any company with social media presence to automatically predict customer's sentiment (i.e.: whether their customers are happy or not). The process could be done automatically without having humans manually review thousands of tweets and customer reviews.
Note: This course works best for learners who are based in the North America region. We’re currently working on providing the same experience in other regions.
Data Science Methodology
If there is a shortcut to becoming a Data Scientist, then learning to think and work like a successful Data Scientist is it. Most of the established data scientists follow a similar methodology for solving Data Science problems. In this course you will learn and then apply this methodology that can be used to tackle any Data Science scenario.
The purpose of this course is to share a methodology that can be used within data science, to ensure that the data used in problem solving is relevant and properly manipulated to address the question at hand.
Accordingly, in this course, you will learn:
- The major steps involved in practicing data science
- Forming a business/research problem, collecting, preparing & analyzing data, building a model,
deploying a model and understanding the importance of feedback
- Apply the 6 stages of the CRISP-DM methodology, the most popular methodology for Data Science and Data Mining problems
- How data scientists think!
To apply the methodology, you will work on a real-world inspired scenario and work with Jupyter Notebooks using Python to develop hands-on experience.
Popular Internships and Jobs by Categories
Find Jobs & Internships
Browse


© 2024 BoostGrad | All rights reserved