Back to Courses
Crash Course on Interactive Data Visualization with Plotly
Overview
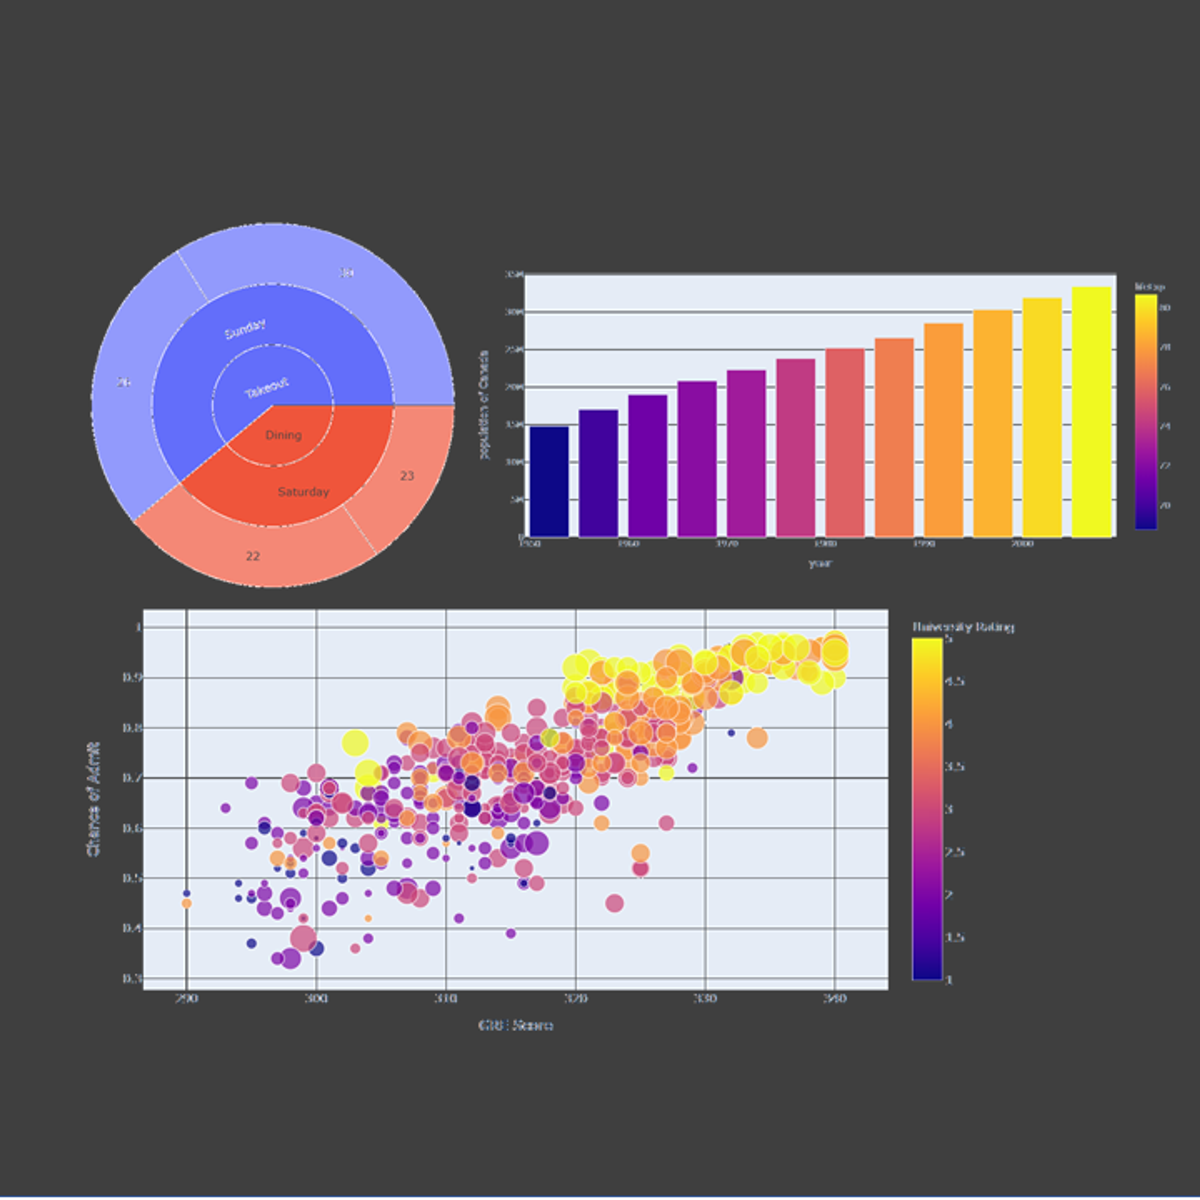
In this hands-on project, we will understand the fundamentals of interactive data visualization using Plolty Express. Plotly Express is a powerful Python package that empowers anyone to create, manipulate and render graphical figures with very few lines of code. Plotly Express is the recommended entry-point into the plotly package. We will leverage Plotly Express to generate interactive single Line plots, multiple line plots, histograms, pie charts, scatterplots, bubble charts, and bar charts. Note: This course works best for learners who are based in the North America region. We’re currently working on providing the same experience in other regions.
Your dream job is just a tap away — only on the BoostGrad app.

View on Boostgrad App
View on Browser
Continue
Download the app