Back to Courses
Visualizing Citibike Trips with Tableau
Overview
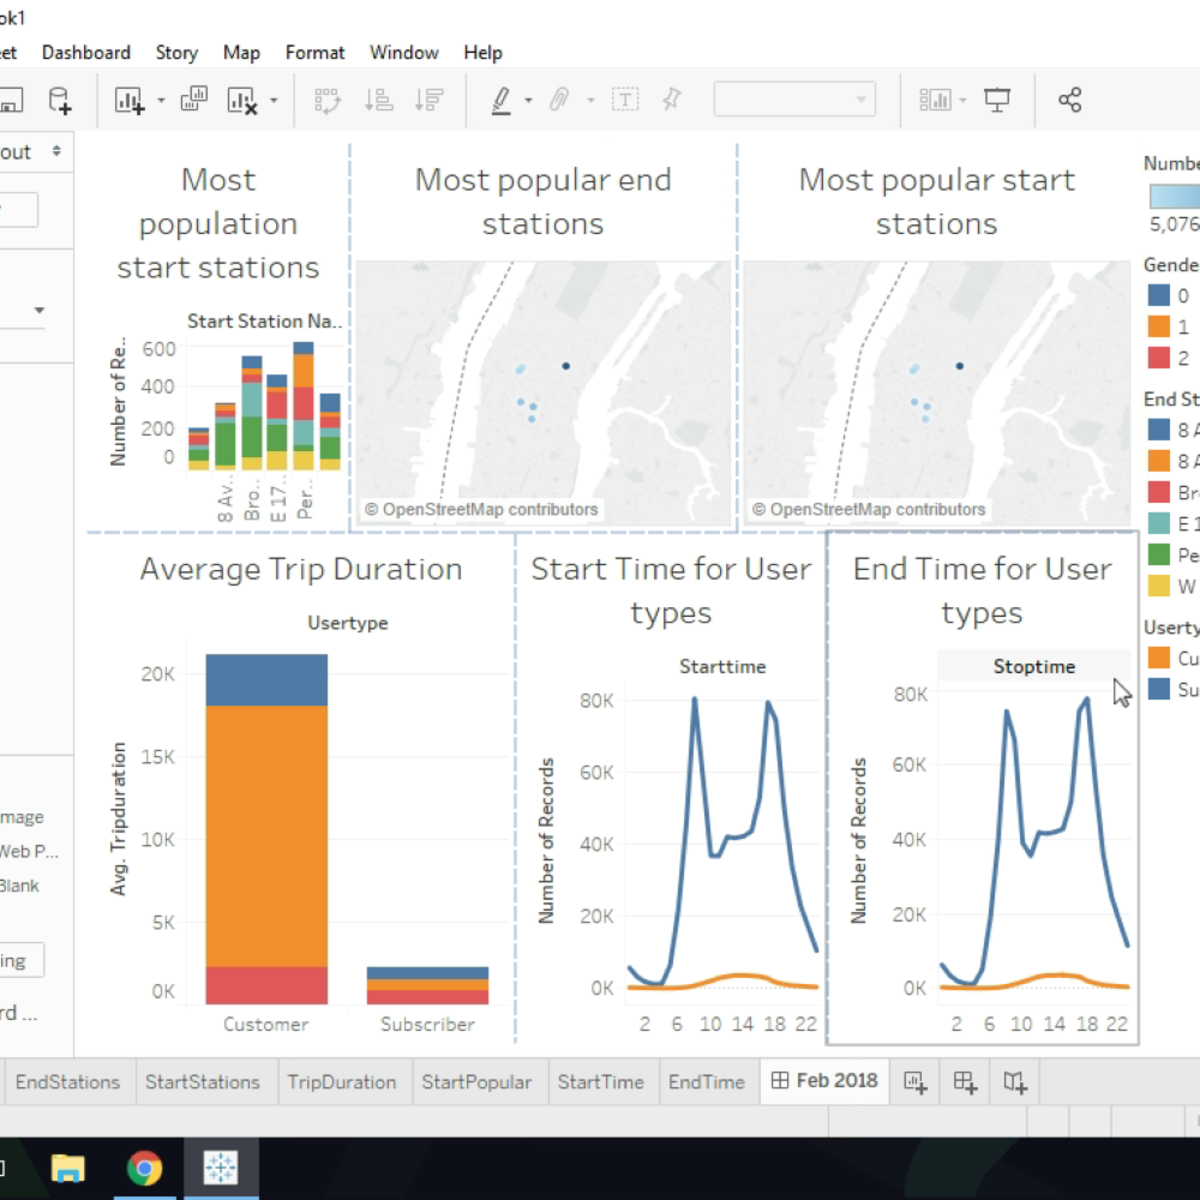
In this 1-hour long project-based course, you will learn the basics of using Tableau Public software to visualize Citibike Trips Dataset. By the end of this project, you will have created a few visualizations and a collection of visualizations called a dashboard. Note: This course works best for learners who are based in the North America region. We’re currently working on providing the same experience in other regions.
Your dream job is just a tap away — only on the BoostGrad app.

View on Boostgrad App
View on Browser
Continue
Download the app